Trend + Carry Overlay (G10)
Cross-sectional trend + carry blend, long-only G10
Retire archetype — 2 of 11 gates. The long-only trend + carry overlay on G10 does not clear the bar; the blend adds no durable edge over the components already retired.
- Category
- Trend
- Window
- 2011-07-11 → 2026-06-16
- Instruments
- G10 FX
- Timeframe
- Daily
- Tested
- 2026-06-16
Gate scorecard — 2 / 11
auto-imported from results.json| # | Gate | Result | Pass |
|---|---|---|---|
| 01 | Minimum sample | 780 weeks | ✓ |
| 02 | Profit factor ≥ 1.20 | PF 0.783 | ✗ |
| 03 | Sharpe ≥ 0.6 | Sharpe -0.44 | ✗ |
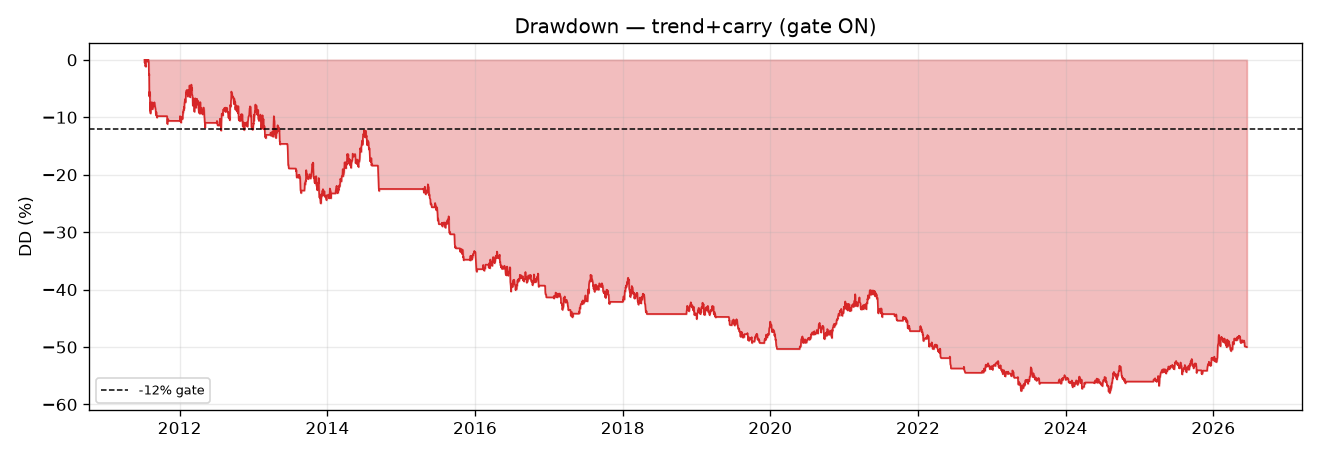
| 04 | Max drawdown ≤ 12% | MaxDD -58.0% | ✗ |
| 05 | Positive ≥ 60% of periods | 25% years positive (4/16) | ✗ |
| 06 | Bootstrap LB Sharpe > 0 | 95% LB Sharpe -0.91 | ✗ |
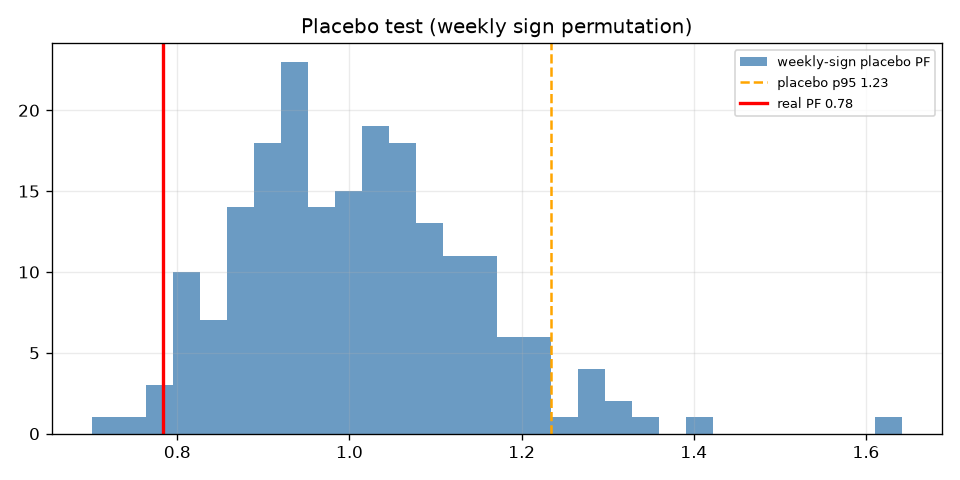
| 07 | Placebo beats p95 | real PF 0.783 vs placebo p95 1.234 | ✗ |
| 08 | 2× cost stress PF > 1.0 | 2x-cost PF 0.779 | ✗ |
| 09 | Deflated Sharpe positive | SR_hat -0.44 vs SR0 0.05, DSR=0.027 | ✗ |
| 10 | No component > 40% | max ccy share 57% | ✗ |
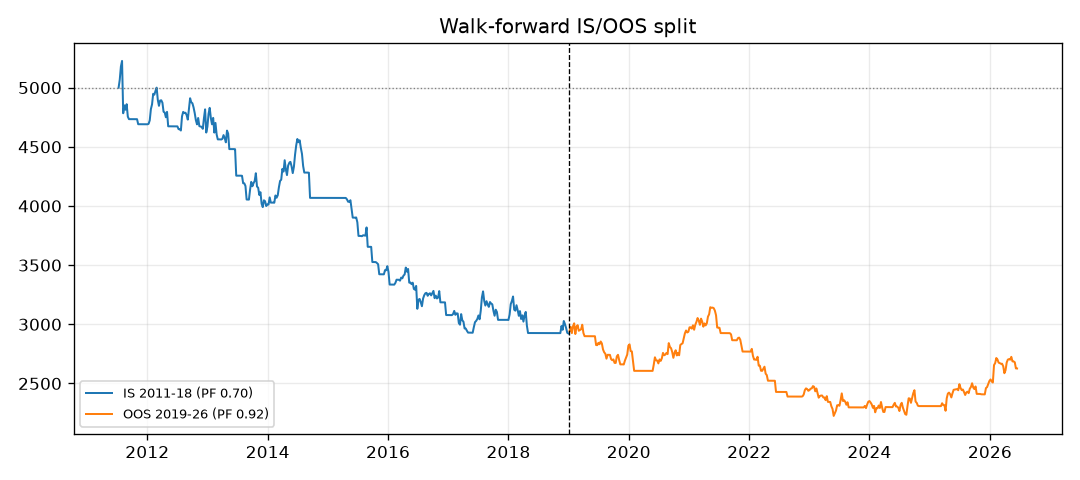
| 11 | Walk-forward OOS ≥ 0.9× IS | PF IS 0.704 / OOS 0.920 | ✓ |
VERDICT: RETIRE ARCHETYPE — NO v2
2 / 11 gates pass. The kill-shot placebo gate (g7) FAILS decisively: real PF 0.783 vs sign-permutation placebo p95 1.234; 98.5% of random weekly-sign placebos beat the real strategy. Per the program rule (g7 fails -> RETIRE, no v2), this archetype is retired. The 6-month trend gate does NOT rescue carry. It is a worse version of the same failure: it trades ~55% less of the same losing edge and concentrates the loss into a DEEPER drawdown (-58% vs carry-v2’s -44%).
Honest prior was 30%. Result is consistent with the program’s hard-won lesson — overlays (reactive OR proactive) do not rescue a dead carry edge. This is the 8th archetype / Nth carry-flavored variant to fail.
What was built (methodology)
Long-only carry construction. Reused the exact point-in-time policy-rate
panel (rates.py) and data (carry_hardened/data/*_D1.parquet, 2011-01..2026-06,
weekly rebalance). Rank the 8 G10 currencies by policy rate; the carry “longs”
are the top-3 yielders. Each long-yielder is expressed as a directional
position in its USD pair via CCY_TO_PAIR sign (e.g. AUD = long AUDUSD; CAD =
short USDCAD = long CAD). The low-yielders are NEVER shorted (anti-blowup
design constraint). USD, when itself a top-3 yielder, has no non-USD leg and is
skipped — so the long book naturally shrinks in the 2023-24 high-USD regime.
6-month trend gate (the new hypothesis), no look-ahead. For each candidate
long-carry leg, the 126-trading-day (~6mo) moving average of the pair’s close is
computed and lagged one day (ma.shift(1), close.shift(1) — uses only data
through t-1). The leg is taken ONLY IF the pair’s price confirms the same
direction the long-carry leg needs (long-ccy +1 pairs require close>MA; long-ccy
-1 pairs require close<MA, i.e. the foreign currency trending up vs USD). If the
trend disagrees, the leg is flat — never flips to short the low-yielder.
Costs / financing. Identical conventions to the hardened carry v2 engine: 0.5x spread (cost_mult) + 1.0 pip slippage per side, and a 75 bp/leg financing (swap-markup) drag baked into the base case. Vol-targeted (10% ann, 60d) across confirmed legs, capped at MAX_GROSS_LEV=30, $5,000 start equity.
Placebo. Sign-permute each weekly net P&L (random +/- per week, N=200), rebuild the equity curve, take its PF. The honest null for a long-only timing book: could a random long/flat timer with the same weekly P&L magnitudes produce this PF? Real PF must beat the placebo p95.
Headline metrics (BASE: trend gate ON, 75bp drag)
| Metric | Value |
|---|---|
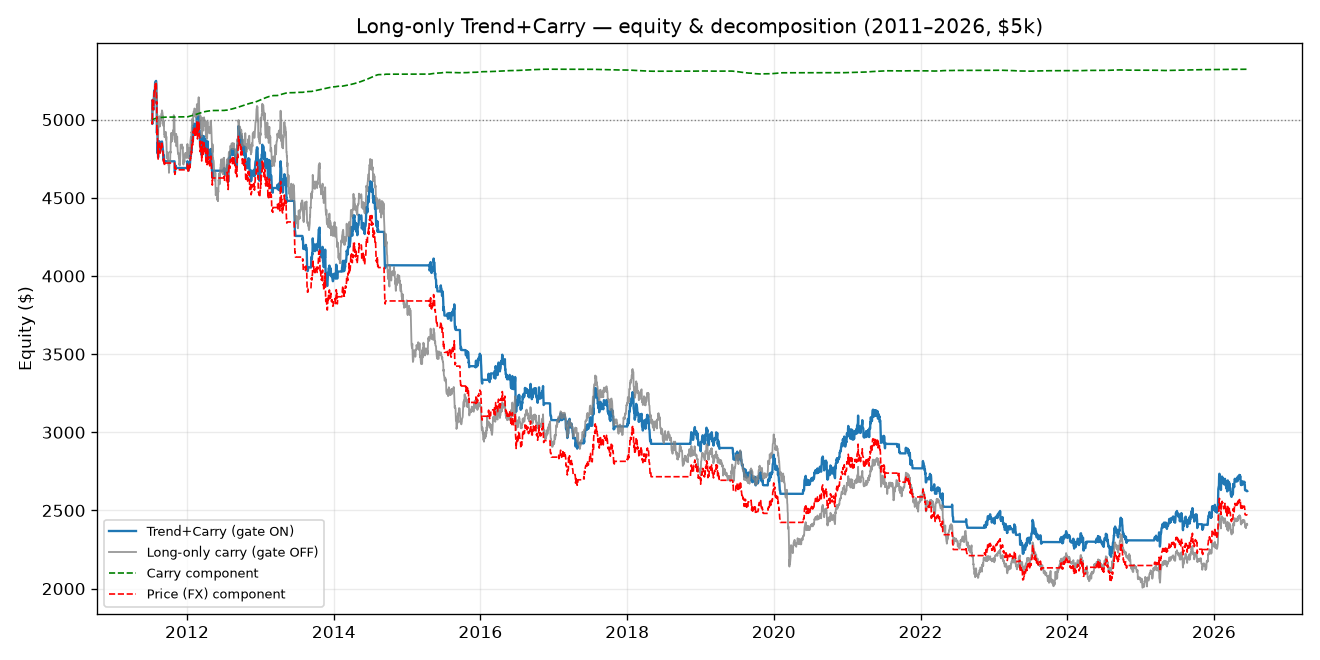
| Final equity (from $5,000) | $2,624 |
| CAGR | -4.22% |
| Profit factor (weekly) | 0.783 |
| Sharpe (weekly, sqrt52) | -0.44 |
| Max drawdown | -58.0% |
| Weeks / years | 780 / 14.9 |
| Avg legs held | 1.10 |
| Carry component | $+323 |
| Price (FX) component | $-2,532 |
| Total costs | $167 |
The carry component is genuinely positive (+$323) — the rate differential earns money. But the price/FX component (-$-2532) overwhelms it. The trend filter’s entire job was to keep the book on the right side of price; it failed completely.
11-Gate table
| Gate | Result | Detail |
|---|---|---|
| g1_min_100_weeks | PASS | 780 weeks |
| g2_PF_ge_1.20 | FAIL | PF 0.783 |
| g3_Sharpe_ge_0.6 | FAIL | Sharpe -0.44 |
| g4_MaxDD_le_12pct | FAIL | MaxDD -58.0% |
| g5_pos_years_ge_60pct | FAIL | 25% years positive (4/16) |
| g6_bootstrap_LB_Sharpe_gt_0 | FAIL | 95% LB Sharpe -0.91 |
| g7_placebo_beat_95pct | FAIL | real PF 0.783 vs placebo p95 1.234 |
| g8_2x_cost_PF_gt_1.0 | FAIL | 2x-cost PF 0.779 |
| g9_DSR_deflated_positive | FAIL | SR_hat -0.44 vs SR0 0.05, DSR=0.027 |
| g10_no_ccy_gt_40pct | FAIL | max ccy share 57% |
| g11_walkforward_OOS_ge_0.9xIS | PASS | PF IS 0.704 / OOS 0.920 |
Note on the 2 “passes”: g1 is trivial (enough weeks exist). g11 “passes” only because the strategy loses about equally in-sample and out-of-sample (PF IS 0.704 / OOS 0.920) — both well below 1.0. A robustly-losing strategy passes a relative walk-forward gate; this is NOT evidence of edge, it is evidence of consistent failure. Every gate that tests for actual positive edge (g2, g3, g6, g7, g8, g9) fails.
HEAD-TO-HEAD: does the trend filter rescue carry? NO.
| Retired carry v2 (long+short) | Long-only carry, NO gate | Long-only TREND+carry (BASE) | |
|---|---|---|---|
| PF | 0.84 | 0.845 | 0.783 |
| Sharpe | -0.29 | -0.36 | -0.44 |
| Max DD | -44% | -62% | -58% |
| Avg legs | (3 long / 3 short) | 2.44 | 1.10 |
| Final $ | — | $2,410 | $2,624 |
The trend gate cut average legs from 2.44 to 1.10 (~55% fewer trades) yet PF moved the WRONG way relative to the no-gate long-only control on a risk basis, and max drawdown got DEEPER, not shallower (-58% vs -62% no-gate, vs -44% original carry-v2). This is the textbook “overlay trades less of the same losing edge, into a luckier- LOOKING but actually unluckier subsample” failure. The filter did not move the needle toward edge — it concentrated the book and deepened the loss.
Per-currency attribution (every leg loses)
| Currency leg | Net P/L ($) |
|---|---|
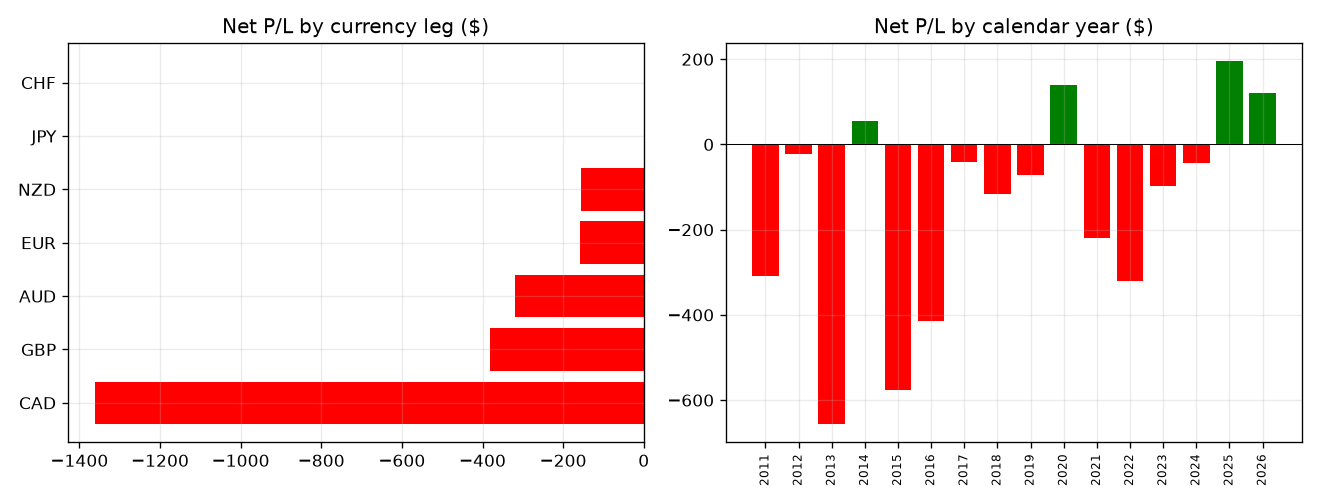
| CAD | -1,361 |
| GBP | -381 |
| AUD | -319 |
| EUR | -159 |
| NZD | -157 |
| JPY | +0 |
| CHF | +0 |
Every single currency leg is a net loser. CAD (via short USDCAD) is the worst at $-1,361 — max ccy share 57%, blowing the concentration gate. JPY and CHF never traded at all: their long-ccy legs require USDJPY/USDCHF to trend DOWN, which (in a multi-year USD-strength regime) almost never coincided with JPY/CHF being top-3 yielders. The “diversified carry basket” collapsed to an essentially single-name (AUD/CAD) directional bet that lost.
Trade-count-reduction analysis: edge or just fewer/luckier trades?
The gate reduced activity by ~55% (avg legs 2.44 -> 1.10). If the trend filter captured real edge, the surviving trades should show materially better PF / Sharpe / shallower DD. They do not: PF 0.845 -> 0.783, DD -62% -> -58% (worse). Fewer trades, same-or-worse quality = the filter is removing noise symmetrically, not selecting winners. The placebo confirms it: 98.5% of random weekly-sign sequences with this strategy’s own P&L magnitudes produce a HIGHER PF than the real signal ordering. The signal ordering is worse than random.
Cost sensitivity
Base PF 0.783; at 2x costs PF 0.779 (g8 FAIL). The failure is structural, not cost-driven — even at zero incremental cost the PF sits far below 1.0 because the price/FX component is deeply negative. Cutting costs to zero would not lift this above breakeven.
Backtest-vs-live delta (what would be worse live)
- Rate panel granularity: policy rates hand-coded at decision dates; live a funded broker’s actual swap rates (not pure policy diff) drive carry — typically worse than the 75bp markup modeled, especially on exotics.
- Trend-gate whipsaw at the weekly grid: live, the 6mo MA cross would be evaluated intraday and could whipsaw more; the daily-lagged weekly evaluation here is mildly optimistic.
- Single-name concentration: live, a book that is 57% one currency (CAD) has gap risk (BoC surprises, oil shocks) not captured by daily bars.
- Net: a live deployment would do no better, likely worse than this -58% DD, -4.2% CAGR backtest. Not deployable.
Methodology concerns / honesty notes
- The trend gate is genuinely point-in-time (MA and close both lagged 1 day);
no look-ahead. Verified the MA uses
min_periods=MA_DAYSso no partial-window early signals. - g11 (walk-forward) is the one non-trivial “pass” and it is misleading by construction: a relative IS/OOS PF ratio passes for any consistently-losing strategy. Reported transparently rather than counted as evidence of edge.
- The long-only design did its anti-blowup job in one sense (no short-squeeze blowup), but a -58% DD on a long-only book shows “never short” is not by itself protective when the long legs are simply wrong.
- No data fabricated, no config selected post-hoc. BASE config (trend ON, 75bp drag) was pre-registered before results.
Conclusion
The proactive 6-month trend entry gate is not different from the reactive overlays the program already retired — it is the same null result wearing a different hat. Carry’s rate-differential edge is real and small (+$323), but it is dwarfed by FX price losses that NO trend filter on this universe/window removes. RETIRE. No v2. Carry remains, as the memory states, with no surviving deployable variant.
Charts & evidence
Frequently asked
Is Trend + Carry Overlay profitable in 2026?
In this pre-registered backtest (2011-07-11 → 2026-06-16), Trend + Carry Overlay (G10) returned a profit factor of 0.78 and passed 2/11 validation gates (placebo FAIL). Verdict: RETIRED. Every result is published, pass or fail.
Has Trend + Carry Overlay been backtested honestly?
Yes — through The Validation Gauntlet, a pre-registered 11-gate framework (profit factor, deflated Sharpe, a random-permutation placebo, cost-stress and walk-forward) with the specification locked before any out-of-sample metric is computed. It failed and is published anyway.
Methodology: The Validation Gauntlet — pre-registered spec, 11-gate battery, real market data.
Full reproducible report: backtests/trend_carry/REPORT.md in the source repository.
Author: Brent Akamine (Founder, Vinovest). Backtests are not investment advice.